


Table of Contents
Invalid traffic can do more than waste ad spend. It can distort conversion data, influence automated bidding, and affect the financial metrics teams use to measure marketing performance.

Quick answer: Performance marketing dashboards report on effects, not root causes. A campaign can look efficient in CTR, CPC, and conversion rate while a meaningful share of the underlying clicks were never a real prospect to begin with. That gap between what the dashboard reports and what actually happened rarely appears as a line item on the balance sheet. That is exactly why it can remain unmeasured for so long.
The stakes are higher than they were even two years ago. More of the decision-making has moved from a human reviewing a report to an algorithm reacting to signals in real time. Performance Max, Advantage+, and Smart Bidding depend heavily on the conversion signals they receive. If invalid activity contributes to those signals, automated systems can optimize around a distorted picture of what a valuable user looks like. A measurement gap that used to just embarrass a media buyer in a quarterly review now actively steers automated budget allocation, at machine speed, before anyone gets a chance to catch it.
Why There Is No Single "Normal" Invalid Traffic Rate
Ask five sources what percentage of paid traffic is invalid, and you will get five different numbers. None of them are wrong exactly. They are measuring different things.
Lunio's 2026 Global Invalid Traffic Report analyzed 2.7 billion paid clicks and put the average at 8.51% across all channels combined, estimating $63 billion in wasted global ad spend annually.
Fraudlogix's Q1 2026 data sampled 26.3 billion programmatic impressions specifically and measured 18.12%, more than double Lunio's blended figure.
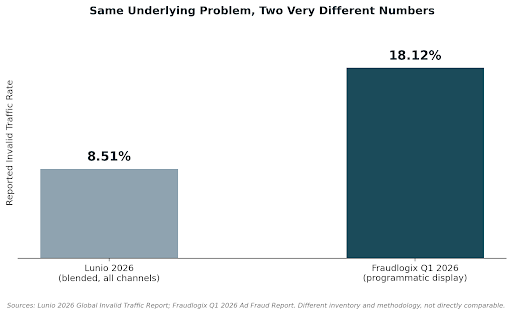
Neither number is more correct. They sample different inventory, different time windows, and different definitions of what counts as invalid. A team that picks one number and treats it as the account's target ceiling is measuring against the wrong yardstick before the analysis even starts.
Vertical matters just as much as methodology.
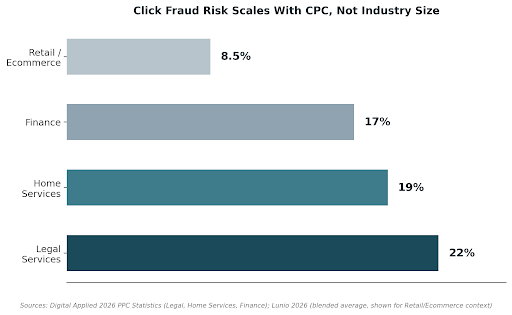
Digital Applied's 2026 PPC statistics roundup found legal services carrying a 22% click fraud rate, home services 19%, and finance 17%. The same underlying economics drive all three: high CPC keywords make competitor clicking and click farms more profitable to run against. A blended 8.5% global average tells a legal services advertiser almost nothing useful about its own risk exposure.
The same problem appears in conversion rate benchmarks, where different methodologies can produce substantially different results. That variance is another reason to treat external averages as context rather than account-level targets.
The useful benchmark, therefore, is not a universal percentage. It is the account's own historical pattern, adjusted for channel and vertical.
Why This Is a Finance Problem, Not Just a Marketing Metric
PPC.io's conversion rate benchmark analysis makes the sharper point: three credible, recent studies on PPC conversion rate spread across a 2x range, from 3.75% to 7.52%, depending on methodology.
Averaging numbers that disagree by that much doesn't produce a usable truth. It produces mush. The same logic applies directly to invalid traffic benchmarks. The number that matters isn't the industry average. It's the trend against a campaign's own historical baseline.
This is a data quality problem before it's a marketing problem, and it should read as one. Three studies measuring the same underlying phenomenon and landing a factor of two apart isn't an argument for picking the study that flatters the current campaign.
It's a signal that the measurement methodology itself needs scrutiny before any of the numbers get used to justify a decision, the same scrutiny a data team would apply to any dataset with that much variance across sources measuring the same population.
Which Traffic Quality Metrics Should Performance Teams Track?
Chasing an external "normal" number is the wrong instinct. Building a monitoring routine around five specific, internally comparable metrics is what actually catches problems early.
- Invalid and suspicious click rate: Track this against the account's trailing 90-day average rather than an industry benchmark. Review it weekly so short-lived spikes do not disappear inside a monthly average.
- Repeat-source concentration: Track what share of flagged clicks trace back to the same IP ranges, device fingerprints, or session identifiers reappearing across days. A high concentration points to organized activity rather than random noise.
- Session quality on click-through: Bounce rate alone is weak evidence. Session duration under two seconds combined with zero scroll depth, at volume, is a much stronger composite signal and worth tracking as its own metric rather than folding it into a generic engagement score.
- The gap between raw conversions and accepted, qualified outcomes: Cost per qualified lead diverging sharply from cost per raw conversion, especially if that gap widens over consecutive months, often reveals traffic quality problems that conversion rate alone hides. This matters most for lead-gen accounts, where a "conversion" is a form fill rather than a completed purchase. A bot can trigger a form-fill conversion event just as easily as a real prospect can.
- Vertical risk exposure: High-CPC, high-consideration categories (legal, finance, insurance, home services, and increasingly certain SaaS segments) warrant a materially tighter review cadence than low-CPC retail categories. The economics simply make fraud more worthwhile to run against them. A legal services account and a low-margin retail account should not be reviewed on the same schedule or held to the same tolerance, even if both sit inside the same agency's client roster.
When Should a Traffic Anomaly Trigger Action?
Not every anomaly deserves the same response. Treating every deviation as an emergency burns credibility with both the marketing team and finance. A three-tier structure, watch, investigate, escalate, keeps the response proportional to the evidence.
The thresholds below are illustrative starting points, not universal rules. Each account should calibrate its own thresholds from its historical baseline rather than adopting these figures as fixed policy.
Watch (log it, recheck next cycle): a single week where CPC rises 5 to 10% without a matching conversion rate drop. A small, isolated spike in traffic from one unfamiliar geography. A modest increase in bounce rate that coincides with a known seasonal or promotional shift.
Investigate (run a structured check within days): CPC climbing for two or more consecutive weeks while conversion rate stays flat or falls. A cluster of clicks concentrated in a narrow IP range or device type. Cost per qualified lead diverges materially from cost per raw conversion for a sustained period.
Escalate (pause spend or engage tooling immediately): repeat-source concentration confirmed across multiple campaigns simultaneously. Invalid click rate on a high-CPC vertical account exceeding the account's own established baseline by a wide margin. Documented evidence of clicks clustering around a competitor's known promotional windows.
ClickFortify's 2026 benchmark framework makes a similar point: no single warning sign proves fraud on its own. A pattern across several of these signals together is what justifies moving from monitoring to action.
How Often Should Paid Traffic Quality Be Reviewed?
A monitoring routine that only runs when performance visibly drops is a routine that catches problems months late. The five metrics above need a fixed cadence, not a reactive one.
Weekly: track invalid click rate against the trailing baseline and flag any deviation exceeding the "watch" threshold.
Monthly: run the full repeat-source and session-quality checks across every active campaign, not just the ones that look off.
Quarterly: recalibrate the account's own baseline entirely. A legitimate shift in audience, channel mix, or seasonality can move the numbers just as much as a traffic quality problem can. Using a stale baseline produces false positives.
This is where automated click fraud detection can become useful. It can run repeat source and session quality checks continuously and create a timestamped record for review. The technology does not replace human judgment, but it can make the monitoring process more consistent and less dependent on manual reporting, whether that review sits with an in-house analyst or the digital marketing agency running the account.
What Are the Most Common Traffic Quality Measurement Mistakes?
Four mistakes account for most of the false confidence teams have in their traffic quality data.
|
Mistake |
Better approach |
|
Treating platform credits as proof of clean traffic |
Use independent traffic quality signals |
|
Using a global benchmark as the target |
Compare against the account's historical baseline |
|
Treating one metric as proof |
Look for patterns across multiple signals |
|
Using an outdated baseline |
Recalibrate it periodically |
Google and Meta both filter and credit back some invalid activity automatically, but that process is built for billing accuracy, not comprehensive fraud detection. It consistently under-reports relative to independent measurement.
An 8.5% invalid traffic rate might be a real problem for a low-CPC retail account and a rounding error for a high-CPC legal services account: the number only means something next to the right comparison point. Every metric in the five above is a supporting signal, not a verdict on its own.
It is the pattern across two or three of them together, especially repeat-source concentration paired with session quality, that actually holds up under scrutiny.
The Bottom Line
The invalid traffic problem inside most performance marketing teams is not that nobody knows it exists. It is that nobody has assigned it a specific owner, a specific metric, or a specific threshold for action, so it sits underneath the reported numbers indefinitely. Build the monitoring cadence around your own baseline, not an industry average, and the "hidden" part of this problem stops being hidden.
For this article, I’d keep the FAQs tightly focused on traffic quality, invalid traffic, measurement, and the finance impact rather than introducing new topics.
FAQs
Invalid traffic refers to clicks, visits, or interactions that do not represent genuine user interest. It can include bots, automated activity, click farms, accidental interactions, and other suspicious sources.
Invalid traffic can consume ad spend without creating genuine business value. It can also distort conversion data, making campaigns appear more effective or less effective than they actually are.
Teams can monitor invalid click rate, repeat source concentration, session quality, and the gap between raw conversions and qualified outcomes. Reviewing these signals together is more reliable than relying on one metric.
Industry benchmarks can provide context, but they should not be treated as universal targets. A campaign's own historical data, channel mix, and vertical provide a more useful comparison point.
Invalid traffic can affect CAC, forecasting, payback calculations, and other financial models that depend on marketing conversion data. Poor traffic quality can therefore create a data integrity problem beyond the media budget itself.


Head Of Digital Marketing
Recent Blogs


Elia Martell
5 Virtual Recruiting Support Operations for Tech and Healthcare Teams
-

09 Oct 2026
-

8 Min
-

477
Jane Hart
Why LinkedIn Campaign Optimization Requires More Than CPC and CTR
-
09 Oct 2026
-
8 Min
-
155

Jane Hart
How to Vet an Offshore SEO Partner: A Due-Diligence Checklist for Agencies and Brands
-
08 Oct 2026
-
8 Min
-
263
Jane Hart
Benchmarking GPU Providers: A Practical Guide to Comparing Cloud Compute Options
-
07 Oct 2026
-
6 Min
-
173
