- Home
- Blogs
Understanding Instagram Story Viewer Insights: What the Data Means
Learn how to understand Instagram Story Viewer insights and use the data to grow your audience and improve engagement.

Mastering Instagram Stories has become critical to a successful social media strategy in today's competitive digital landscape. Offering the chance to connect with an audience, promote a brand, and drive real business results, more than 500 million people are using Instagram Stories every day. But simply posting stories is not enough—you need to harness the power of Instagram by optimising your approach through understanding key analytics and using them to inform your content decisions.
The beauty of Instagram Stories by instanavigation as they are real-time and short-form, hence allowing continued learning and adaptation. Analyse the performance data—reach impressions, engagement rates, and audience feedback—to fine-tune the strategy to achieve the goals you set. Use the power of Instagram Stories Analytics to drive decisions, make improvements to content, and nurture your audience—whether your objective is growing brand awareness, driving traffic, or boosting conversions. This guide explores practical steps in optimising your Instagram Stories strategy to raise your brand presence.
?Introduction to Instagram Story Analytics
Instagram Story analytics gives you insight into how your Stories are doing, allowing you to track engagement, reach, and interactions. We group these metrics into three categories: engagement (likes, shares, replies), reach (impressions, accounts reached), and navigation (viewer actions like taps and exits). You can use these metrics to understand what resonates with your audience, adjust your content strategy accordingly, and ultimately improve engagement and brand awareness.
?Why Instagram Story Analytics Matter for Your Strategy?
Instagram Story analytics are very important in optimising your content strategy because of the key insights you derive from how your stories are performing. You can see what content resonates with your audience by keeping track of certain metrics such as engagement, reach, and navigation. Understanding these analytics allows you to increase users' interaction with your content, increase brand visibility, and create content catered to achieve specific business goals. Ultimately, leveraging Story data helps you make informed decisions that drive engagement and improve overall performance.
?What is Instagram Story Analytics?
The analytics of an Instagram Story gives insightful, precise information that categorises the performance of your Story by the breakdown in these three key categories: engagement, reach, and navigation. Based on the Engagement metrics trace interactions such as replies and sticker taps; reach registers impressions and counts all the accounts reached. Navigation metrics capture actions like taps back or forward and exits from the story view. By leveraging these metrics, you can enhance your understanding of audience behaviour, improve content and further optimise user engagement. Instagram Story Analytics assists in making a data-driven approach towards improving your online presence on social media.
?Understanding the key metrics behind Instagram stories
These are the key Instagram metrics that assist in tracking content performance and audience engagement. These include the engagement rate of impressions, which measures interactions relative to views, and the importance of saves, which indicate the long-term value and algorithmic favour. Other metrics, like referral traffic, Reels performance, and profile interactions, provide insights into how well Instagram drives user actions and website visits. By tracking these, brands can fine-tune their strategies to maximise engagement and reach.
?Key Metrics to Track in Instagram Stories
Key metrics for tracking Instagram stories include story replies, link taps, taps back and forward, exits, and impressions. These metrics offer insights into how engaging and interactive your stories are, revealing how users navigate through them and respond to your content. Monitoring these can help brands adjust their strategies to increase engagement and improve viewer retention.
?Discovery Metrics: Tracking Reach and Impressions
Reach and impressions are essential for understanding how many unique users are viewing your stories and how frequently they appear. Impressions show how often your content is viewed, while reach focuses on the number of individual users. These metrics are vital for assessing the visibility of your stories and adjusting your content distribution strategy.
?Navigation Metrics: Understanding Story Flow
Metrics like Taps Back, Taps Forward, and Exits reveal how users are moving through your stories. Taps Back indicates interest in revisiting a slide, while Taps Forward shows how quickly users skip content. Exits highlight when viewers drop off, helping identify weak points in your story flow or areas needing improvement.
?Interaction Metrics: Measuring Engagement and Clicks
Story replies and link taps are crucial for measuring user engagement directly. Replies show active participation, while link Taps indicate how many users are compelled to take action and visit your linked content. These metrics reflect how well your stories drive deeper interactions with your brand.
?How to Access Instagram Story Analytics
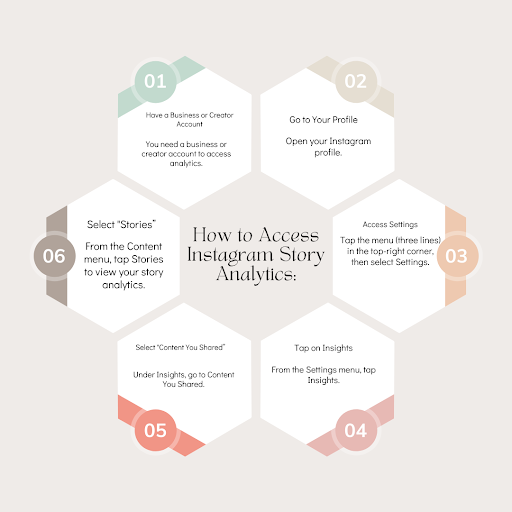
To access Instagram Story analytics, you need a business or creator account. Once in your profile, go to "Settings," tap "Insights," and select "Content You Shared" followed by "Stories" to review your metrics. Key metrics include reach, impressions, link clicks, shares, and user actions like taps forward or backwards. Detailed insights help you gauge engagement and make necessary adjustments to improve the performance of your stories.

?Steps to access insights on Instagram
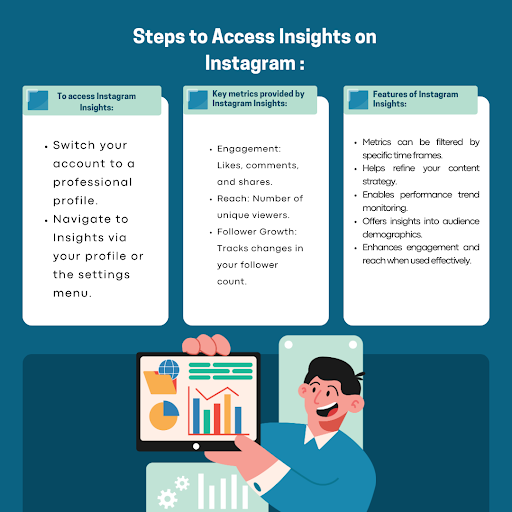
To use Instagram Insights, switch to a professional account. Access Insights from your profile or settings. This tool shows metrics like engagement (likes, comments, shares), reach (unique viewers), and follower growth. You can filter data by time frame to track trends, understand your audience, and improve your content strategy.

?Accessing Instagram Story Analytics via Sprout Social
To use Instagram Insights, switch to a professional account. Access Insights from your profile or settings. This tool shows metrics like engagement (likes, comments, shares), reach (unique viewers), and follower growth. You can filter data by time frame to track trends, understand your audience, and improve your content strategy.
?Use Hootsuite to track Instagram story metrics.
Hootsuite offers powerful tools to track Instagram Story metrics, such as exits, replies, and taps forward/back, helping measure engagement. The platform also allows users to track website traffic through Ow.ly links and create custom reports. Advanced features like sentiment analysis and competitor benchmarking enhance social media strategy optimisation.
?Instagram Story Analytics Breakdown
-
Reach vs. Impressions: What’s the Difference?
Reach counts the number of unique users who viewed your story, reflecting the breadth of your content’s exposure. Impressions, on the other hand, track the total number of views, including multiple views by the same user. Knowing both metrics enables you to assess the frequency of content revisits and the number of new users it draws.
- Tracking story responses and taps for engagement
Replies show deeper engagement as users interact directly with your story through messages or emoji reactions. Taps (forward or back) provide insight into how viewers navigate your content—whether they skip sections or go back to rewatch certain frames. Monitoring these metrics can guide you in fine-tuning the pacing and interactive elements of your stories.
- Measuring Story Exits: How to Minimize Them
Exits occur when users leave your story entirely, swiping to another account or closing the app. High exit rates suggest your content may lose viewer interest or become too repetitive. To minimise exits, create more engaging and concise stories and ensure each frame maintains the viewer’s attention with valuable content.
?How to Optimize Your Strategy Using Story Analytics
-
Leveraging Instagram Stickers to Boost Discoverability
Using Instagram’s interactive stickers, such as hashtags and location tags, enhances the discoverability of your Stories by placing them in broader, searchable streams. This allows your content to reach users beyond your followers, driving organic growth and engagement.
-
Using audience insights to guide content creation
Instagram’s Audience Insights provides valuable data, such as when your followers are most active and what content resonates most with them. Using this information, you can personalise your stories and schedule the posting times to get more engagement. Additionally, you can tailor the content formats to align with your audience’s preferences for higher engagement.
-
Scheduling Stories for Maximum Engagement
By scheduling stories during peak activity hours, identified through your analytics, you can ensure your content reaches followers when they’re most likely to engage. Consistent timing helps boost visibility, increasing the chances of your Stories appearing at the top of followers' feeds.
-
The Power of Call-to-Actions in Stories
Include clear and compelling call-to-actions within your Stories. Encourage followers to swipe up, shop, or share. A well-placed CTA leads to higher conversion rates and strengthens the connection with your audience.
?Conclusion
Optimisation of the Instagram Story viewer strategy revolves around using data-driven insights to make it more discoverable, increasing engagement, and then converting the viewers into buyers. With interactive features, customised content based on preference, optimal posting times, and clear calls to action, your Story can do much better in terms of performance. Analysing and adjusting these things consistently ensures that the content remains relevant, engaging, and impactful, hence supporting long-term growth and strong relationships with your audience.

