Table of Contents
Turn survey feedback into powerful insights with AI-driven analysis. Explore 10 ways to uncover themes, detect emotions, and make data-driven decisions faster and more accurately from open-ended responses.
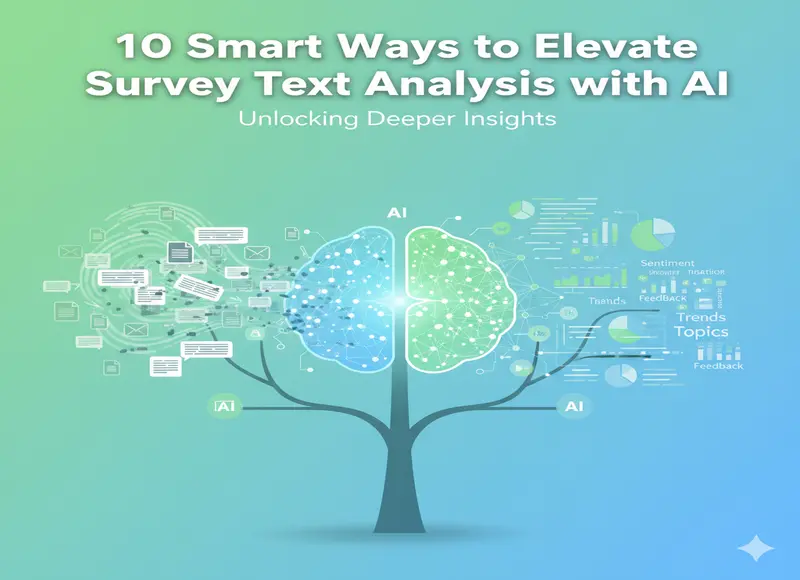
AI-driven survey text analysis is reshaping how organizations understand feedback from respondents, moving beyond basic metrics to uncover authentic insights hidden within open-ended survey responses.
With the immense growth of digital survey tools and vast pools of qualitative data, the ability to interpret free-text answers with precision and depth is now central to market research, organizational development, and customer experience strategy.
The Power of AI in Understanding Human Feedback
AI-driven survey text analysis helps organizations understand open-ended responses more clearly. These responses often contain the real reasons behind the numbers. To further refine AI-processed responses, teams can review them with Undetectable AI to ensure the output reads naturally and aligns with authentic human expression. By using natural language processing and machine learning, AI-driven survey text analysis can quickly read and interpret large amounts of text.
With AI-driven survey text analysis, similar ideas can be grouped automatically. Emotions and trends can be detected, and contradictions can be highlighted. This makes it faster and easier to turn survey responses into useful insights.
To get the best results from AI-driven survey text analysis, clean data and clear question design are essential. When applied correctly, it adds depth and accuracy to survey analysis and supports better decision-making.
Now that we understand its potential, let’s explore 10 smart ways to improve survey text analysis and uncover deeper insights.
1. Start with Clean, Organized Data
These data must be cleaned first for duplicates or errors and made uniform with standard terms.
Then the data can be used with more advanced data analysis software to identify similar concepts and clearer patterns of common themes and tones across multiple sources, even if they are expressed differently.
Good data quality reduces the amount of noise and increases the information in the data, making it easier to derive perceptions.
It also saves time and money by reducing the amount of analysis needed due to simple issues that can be avoided.
The accurate and efficient analysis of survey data requires a well-constructed dataset.
2. Build a Focused Question Framework
The word choice of the survey items to be analyzed (questions) has an important influence on the result of the text analysis.
Instead of a great variety of scattered and broad questions, it is advisable to use fewer, more focused and well-formulated questions and prompts, which will lead to richer information expressed by the respondents.
A question framework accommodates responses, detects sentiment, and extracts themes.
Organizations can create messages based on questions, leading to useful recommendations while avoiding ambiguous responses.
3. Use NLP for Sentiment Classification
Natural Language Processing (NLP) techniques, such as sentiment analysis, categorize responses as positive, negative, or neutral and can identify nuanced emotions like frustration or joy.
A study on sentiment analysis techniques highlights the importance of data quality and preprocessing in achieving accurate AI-driven insights.
This multidimensional emotional understanding empowers organizations to address issues holistically and celebrate successes effectively.
4. Identify Themes with Topic Modeling
Topic modeling clusters survey comments into key themes such as customer service, pricing, or product features without human bias.
This automated grouping reveals recurring topics quickly, allowing teams to focus on priority areas even in vast datasets.
Organizations can gain similar actionable insights by exploring how AI analytics uncover key business trends.
5. Automate Text Coding to Save Time
Manual coding is time-consuming.
Text coding automation is a process that classifies open-ended responses based on the content, sentiment, and other criteria.
It provides summaries of responses and can provide an overall picture of the themes and the sentiment of responses.
It provides the benefit of being able to quickly automate the analysis of a large volume of responses into summary blocks, reducing bias in interpretation and enabling smaller trends or issues to be identified.
This efficiency saves teams from having to sort through results for hours before coming to a conclusion or making a change.
6. Visualize Insights for Better Decisions
The survey results can be viewed by stakeholders in dashboards, charts, graphs, heatmaps, and by sentiment and trend lines in all areas where customer satisfaction has increased or declined and requires attention.
Data visualization makes it easier for teams to see patterns and prioritize what to focus on.
Departments view interactive dashboards, and end users filter data using them.
If you follow this path, you can eventually visualize and reduce the gap between data and perceptions, which enables faster decisions based on evidence.
7. Merge Quantitative and Qualitative Data
A user can indicate where a recommendation might fall on a scale like that of 1–5 stars by giving both a rating and a comment.
The user also says what they liked or disliked about it.
The data types can be used to check for inconsistent data and provide context for pure numerical data.
They help researchers to understand not just what people think, but the why behind that thinking, which in turn leads to more human, more rational, and more authentic customer decisions.
8. Leverage Predictive AI Models
Using predictive analytics on survey responses allows us to predict behavior, such as churn and views, so we can optimize them before they become a problem, to keep the customer happy before they stop using us.
These models also help us understand the drivers of retention and loyalty.
The ability to anticipate customer needs improves how organizations communicate with customers, plan promotional activities, or offer support, i.e., predictive becomes an integral part of planned planning.
9. Include Multilingual Analysis for Global Audiences
Furthermore, in the case of companies that operate globally, the software's artificial intelligence includes multiple languages and integrated AI translation tool so that brands can listen and collect feedback and opinion data from anyone, no matter the language, so that no valuable customer perception is lost in translation.
Multilingual analysis allows for the culture, tone, and region to be taken into consideration so that the brand can tailor its strategy appropriately.
10. Continuously Refine and Train AI Models
The evolution of language and sociocultural context requires constant retraining of survey analysis using AI models as language shifts, new slang emerges, and new meaning styles arise.
Models require continual retraining and improvement to identify and accurately capture the evolution of language trends, with the goal of reducing bias and increasing longevity.
The system can be improved in a feedback loop with accurate, transparent, and contextualized analysis, rather than pure data.
Turning Survey Insights into Action
The most powerful way to use AI to analyze survey text is to distill key themes and topics and deliver them to product, marketing, and support teams.
This approach informs better decisions, enhances customer satisfaction, and drives stronger business outcomes.
By creating a continuous feedback loop, organizations build engagement and trust, transforming surveys into strategic tools for success.
With the right technology and insights, survey analysis evolves from simple commentary to rich storytelling through segmentation.
This enables faster, smarter, and more informed decision-making.
Natural language processing (NLP) makes it possible for companies to automatically identify sentiment, detect trends, and uncover hidden pain points that often go unnoticed.
These insights empower leaders to prioritize initiatives, refine messaging, and elevate product experiences.
By applying AI-derived insights across every level of the organization, everyone can listen, learn, and contribute to meaningful change, helping organizations become more intelligent, agile, and customer-centric in today’s complex and fast-moving world.

Head Of Digital Marketing
Recent Blogs


Isha Choksi
How AI Helps Social Media Managers Plan Content Faster
-

24 Jul 2026
-

5 Min
-

52

Jane Hart
The Biggest Mistakes Sellers Make While Expanding to Multiple Marketplaces
-
22 Jul 2026
-
5 Min
-
91


Jane Hart
How to Evaluate a Software Development Company's Portfolio: What Actually Matters Beyond the Logos
-
14 Jul 2026
-
5 Min
-
290